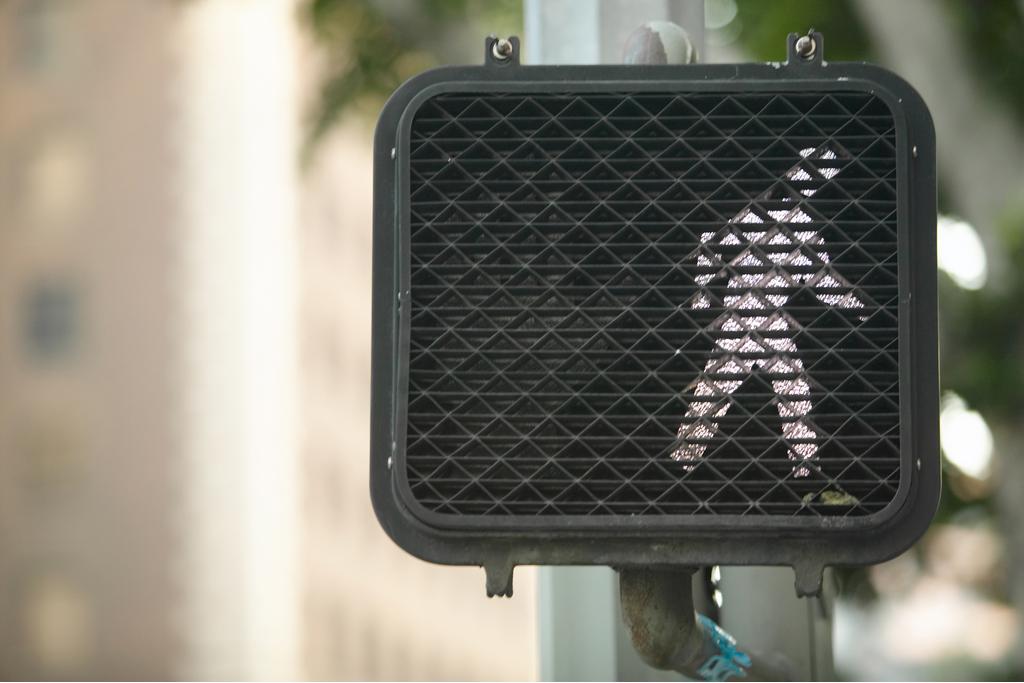
Compared to 40 years ago, pedestrians on U.S. roadways are far safer. According to figures from the Governors Highway Safety Association, pedestrian fatalities have declined from more than 7,500 in 1975 to about 4,700 in 2013, a 37 percent reduction compared with a 24 percent reduction in all other car-related deaths during the same period. Still, in recent years, the death toll for pedestrians has been on the rise.
Related: DOT Targets 'Megaregions' for Highway Planning Forums
Between 2009 and 2013, the number of pedestrians killed by cars increased 15 percent; 20 percent of those incidents involved hit-and-runs. That equates to one pedestrian killed every two hours. In August, GHSA released its report, "Everyone Walks: Understanding and Addressing Pedestrian Safety," which made a number of pedestrian safety recommendations. It advises states to adopt strong "move-over laws" to address the large number of deaths involving people who are struck while stopped on the roadside.
"Many pedestrian fatalities involve motorists who became unintended pedestrians due to vehicle breakdowns or emergency responders who are struck on the side of the road," GHSA stated. "In fact, an average of 515 pedestrians are struck and killed annually by a motor vehicle on the nation's highways."
While we all should be well aware of the dangers inherent to drinking and driving, many of us may not think as much about drinking and walking. In 2013, a third of pedestrians age 16 or older killed by cars had a blood-alcohol content of 0.08 or higher. That's more than twice the percentage of motorists who were driving drunk when they struck a pedestrian.
Similarly, distracted driving is well known to be among the greatest dangers facing drivers today. Perhaps less talked about is the percentage of incidents attributed to walkers distracted by handheld mobile devices: The rate of injury has nearly quadrupled during the past decade, with an estimated 2 million injuries in 2010.
"Distraction is particularly problematic for teens," GHSA stated. "One in five high school students and one in eight middle-schoolers have been observed crossing the street while texting, wearing headphones or talking on a cellphone."
The ever-present threat of speeding is another leading cause of death for pedestrians. Nearly 20 percent of incidents in which people on foot were killed by cars occurred on roadways with speed limits of 35 mph or less, GHSA reported.
Unsurprisingly, the four states with the largest populations also have the highest raw number of annual pedestrian fatalities. California, the most populous state in the U.S., by far had the most pedestrian deaths with 701, followed by Florida with 501, Texas with 480 and New York with 335. Three of these, California, Florida and New York, have adopted comprehensive plans for reducing pedestrian fatalities in their states, which GHSA made particular note of in its report.
All three of these states have adopted plans that use data analyses to identify high-incident zones - or "crash corridors," as they're referred to in New York, where despite improvements pedestrians still account for more than half of all car-related deaths. Safety officials then allocate resources toward enforcement, education and engineering in these target areas in hopes of reducing incidents where they most commonly occur. One notable element of California's program is it calls for disseminating a message of behavioral change immediately after an incident occurs, in the local area in which it occurs — when and where that message will be most effective. Florida, which has the highest pedestrian-death rate of 2.56 per 100,000 residents, also incorporates on-campus peer-to-peer and social-media driven outreach that promotes personal responsibility across all modes of transportation.
Other states that have implemented notable programs, GHSA said, include Connecticut, Pennsylvania, Delaware, Maryland, North Carolina, Kentucky, Nevada, Minnesota, Washington and Hawaii.
The 20 U.S. cities with the highest pedestrian-fatality rates as of 2013, followed by the number of deaths per 100,000 residents, are:
1. Detroit, 6.1
2. Jacksonville, Fla., 3.93
3. Memphis, 3.83
4. Tucson, Ariz., 3.61
5. Phoenix, 3.44
6. Dallas, 3.02
7. San Antonio, 2.98
8. Albuquerque, N.M., 2.88
9. Oklahoma City, 2.62
10. Louisville/Jefferson County, Ky., 2.62
11. Baltimore, 2.41
12. Austin, Texas, 2.37
13. Indianapolis, 2.37
14. Philadelphia, 2.32
15. San Diego, 2.21
16. Denver, 2.16
17. Fresno, Calif., 2.16
18. San Francisco, 2.15
19. New York City, 2.12
20. San Jose, Calif., 2.1
No comments:
Post a Comment