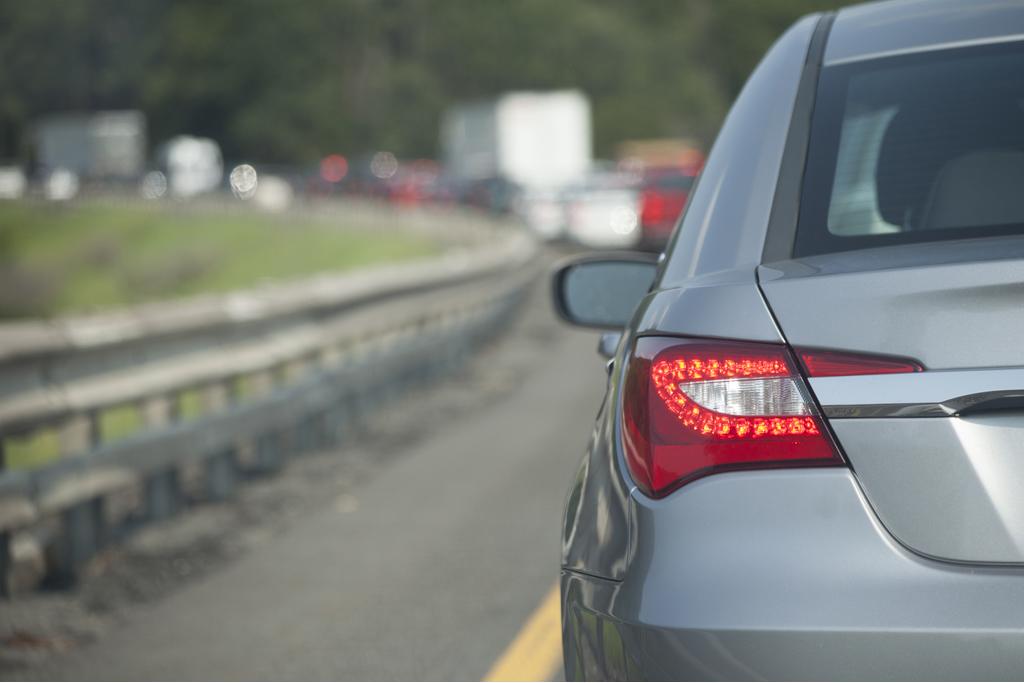
The good news is: People are back to work. The bad news is: They have to get there and back every day. The U.S. economy has regained all of the millions of jobs lost during the last recession, but with our reinvigorated workforce comes equally reinvigorated commuter congestion. According to the 2015 Urban Mobility Scorecard, a joint study by data-analysis firm INRIX and the Texas A&M Transportation Institute, gridlock has returned to 2007 pre-recession levels with a vengeance.
Related: Survey: Commuters' 'Sentence' Gets Longer, Costlier
Traffic delays can be blamed for U.S. drivers wasting more than 3 billion gallons of fuel, 7 billion hours and $160 billion, the annual per-person equivalent of a full workweek and $960. If you think those national averages suck, try living in the cities with the worst roads. In Los Angeles, New York and Chicago, motorists on average lose 3.5 days of their lives each year. Half of the 10 most-congested cities are on the West Coast, three on the East Coast, and one each in the Midwest and South.
"The problem has become so bad in major urban areas that drivers have to plan more than twice as much travel time as they would need to arrive on time in light traffic just to account for the effects of irregular delays such as bad weather, collisions, and construction zones," according to the Texas A&M Transportation Institute.
In addition to a rebounding economy, urban populations are growing while fuel prices are dropping and Americans are driving in record numbers -- and it's all just happening too fast for infrastructure accommodations to keep pace. Researchers say the problem is too overwhelming for urban planners to handle on their own, and the solution will require an "all-hands-on-deck" approach comprising a mix of strategies that includes, for example, greater use of public transportation and more flexibility from employers for telecommuting.
The gridlock dilemma is already twice as bad as it was nationwide in 1982 and quadruple what it was for cities with populations of less than half a million people. And those figures are only projected to worsen within the next five years, with the annual per-person delay growing 12 percent and the total monetary loss rising 20 percent, according to the study.
The top 10 most-congested cities in the U.S., as calculated by INRIX are as follows (metro area, followed by annual average hours in traffic):
1. Washington, D.C./Virginia/Maryland; 82 hours
2. Los Angeles-Long Beach-Anaheim, Calif.; 80
3. San Francisco-Oakland, Calif.; 78
4. New York City/Newark, N.J./Connecticut; 74
5. San Jose, Calif.; 67
6. Boston/New Hampshire/Rhode Island; 64
7. Seattle; 63
8. Houston; 62
9. Chicago/Indiana; 60
10. Riverside-San Bernardino, Calif.; 59
No comments:
Post a Comment