"On a long enough timeline, the survival rate for everyone drops to zero," author Chuck Palahniuk wrote. It's true: In this life we're all basically riding in one big car together, and everyone's just getting out at different stops. Since we at Cars.com are in the business of automobiles and have a vested interest in safety, we wanted to know how driving deaths stack up against other fatalities in terms of probability.
Related: DUI Fatalities Continue Decades-Long Slide
The answer: competitively. According to the Insurance Institute for Highway Safety, car-related deaths have declined by more than a third in just the past three years. This continues a long period of decline since 1985 amid vehicles' ever-improving structural designs and the addition of advanced safety features. Even so, death by car remains a formidable obstacle to reaching the average U.S. life expectancy of 78.8 years.
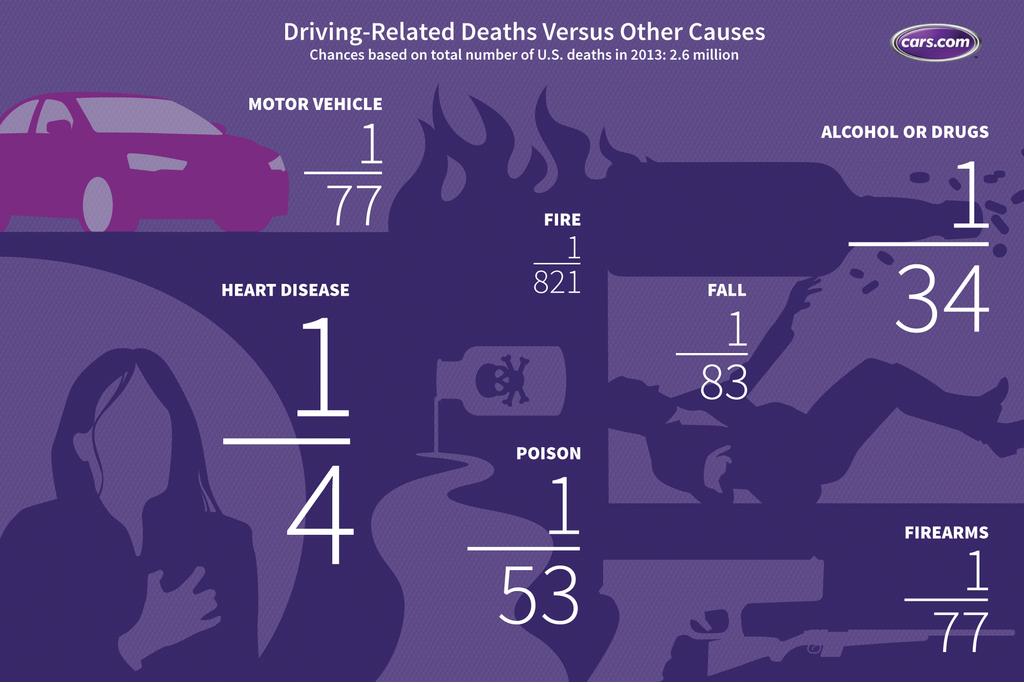
"Motor vehicle traffic" deaths in the U.S. in 2013, the most recent full year of data available, totaled 33,804, for a death rate of 10.7 per 100,000, according to data from the Centers for Disease Control and Prevention. Considering deaths in the U.S. that year totaled slightly less than 2.6 million, the individual American's chances of dying as a result of an automobile crash (which include pedestrians, bicyclists and motorcyclists involved in car crashes) come out to about 1 in 77 — making it one of the highest-probability causes of death tracked by the CDC.
That figure compares to deaths caused by firearms (also a probability of 1 in 77), falls (1 in 83), suicide (1 in 63) and poisoning (1 in 53). By contrast, heart disease, the leading cause of death, kills 1 in 4 people, accidents in general kill 1 in 20, alcohol and drugs kill 1 in 34, as does diabetes, and influenza and pneumonia kill 1 in 46. Meanwhile 1 in 161 die of homicide, 1 in 276 of skin cancer, 1 in 640 of drowning and 1 in 821 of fire.
Of those 33,804 people killed in motor-vehicle accidents: Occupants of the involved vehicles accounted for 8,629, with a death rate of 2.7 per 100,000 and a 1 in 301 chance of dying; pedestrians, 4,989, 1.6 death rate and a 1 in 521 chance; motorcyclists, 4,169, 1.3 death rate and a 1 in 623 chance; bicyclists, 623, 0.2 death rate and a 1 in 4,169 chance; unspecified victims, 15,388, 4.9 death rate and a 1 in 169 chance.
The top 10 states where you're most likely to die in an auto accident, including the number of deaths and death rate per 100,000 people, are:
1. Montana, 237; 23.3
2. Mississippi, 681; 22.8
3. Oklahoma, 727; 18.9
4. Alabama, 909; 18.8
5. Arkansas, 537; 18.1
6. West Virginia, 330; 17.8
7. South Dakota; 145; 17.2
8. North Dakota; 124; 17.1
9. South Carolina; 786; 16.5
10. Louisiana; 761; 16.5
The top 10 states (including the District of Columbia) where you're least likely to die in an auto accident are:
1. District of Columbia, 30; 4.6
2. Massachusetts, 375; 5.6
3. New Jersey, 564; 6.3
4. New York, 1,316; 6.7
5. Rhode Island, 77; 7.3
6. Washington, 537; 7.7
7. Utah, 230; 7.9
8. Hawaii, 112; 8.0
9. Connecticut, 300; 8.3
10. Minnesota, 466; 8.6
On the more hopeful side, despite car accidents still posing a significant risk to American's everyday lives, the roads are getting decidedly safer. U.S. Secretary of Transportation Anthony Foxx, in the DOT's Fast Lane blog, noted that according to National Highway Traffic Safety Administration estimates, highway fatalities in 2014 dropped to their lowest level ever, and were likely to continue on that path in years to come.
"A recent NHTSA study shows that new vehicle safety technologies — from seat belts to electronic stability control — saved 614,000 lives," Foxx wrote. "The vehicles we drive today are loaded with technology, and they are safer than they've ever been.
"But we're not stopping there. In coming years, connected vehicle technologies like crash-avoidance systems and automated driving will very likely change the game."
No comments:
Post a Comment